

Discover the environmental impact of your software with the Software Carbon Intensity Specification (SCI). Explore how SCI unravels the carbon footprint of digital solutions.
Undeniably Climate Change and Global Warming are increasingly topics discussed daily. As the world moves closer together to address these issues with clear emissions targets, the concept of Sustainability offers a framework and set of principles that when understood give us a lens for meeting the needs of the present without compromising our future. The responsibility of achieving these emissions targets doesn’t sit solely on the shoulders of country leaders but also on business leadership and citizens.
Through global treaties like the Paris Agreement, international protocols such as the Greenhouse Gas (GHG) Protocol and national legislation, being able to quantify carbon emissions is now a “must-have” for every company on the planet.
There's been a push across various sectors to quantify and reduce their Scope 1, 2 and 3 emissions. These emissions are defined as:
Scope 1: The direct emissions from own sources,
Scope 2: Indirect emissions from the generation of purchased energy
Scope 3: All other indirect emissions occurring through a company's value chain.
Software, being ubiquitous, is a significant contributor with roughly 3% of all global emissions from software, which is on par, if not higher, than commercial airlines.
Unlike physical goods, the environmental impact of software isn't immediately apparent.
One of the key elements in effecting change is having a consistent, repeatable mechanism for measurement.
With this in mind the Green Software Foundation, a non-profit with the mission to create a trusted ecosystem of people, standards, tooling and best practices for building green software, has developed and released V 1.0 of the Software Carbon Intensity Specification (SCI) v1.0 in late 2022. The (SCI) can help quantify the carbon emissions associated with software, providing a benchmark to make it easier to understand where efficiencies can be made to address emissions outputs.
Why it Matters?
The specification has been developed as part of a larger push towards understanding and reducing the carbon footprint of software and digital systems. As digital technology becomes more embedded in our daily lives, leadership teams have a social responsibility to consider the environmental impact of these systems. The Australian Government confirmed its intention to make climate-related disclosures mandatory for large businesses and financial institutions, as early as 2024.
Calculating Carbon Emissions From Software Systems
The SCI “defines a methodology for calculating the rate of carbon emissions for a software system”. When calculated, the SCI produces a score, the lower the score the better - however it's worth noting that the score can never reach 0. The specification is extensible across all software applications, regardless of size, architecture or hosting footprint.
At its most simplistic the SCI is the rate of carbon emissions per one unit of R. Where C = Carbon and R = a functional unit.
SCI = C per R
Determining Carbon emissions is the most challenging aspect of the equation. The specification provides the following method for calculating Carbon as part of an expanded equation:
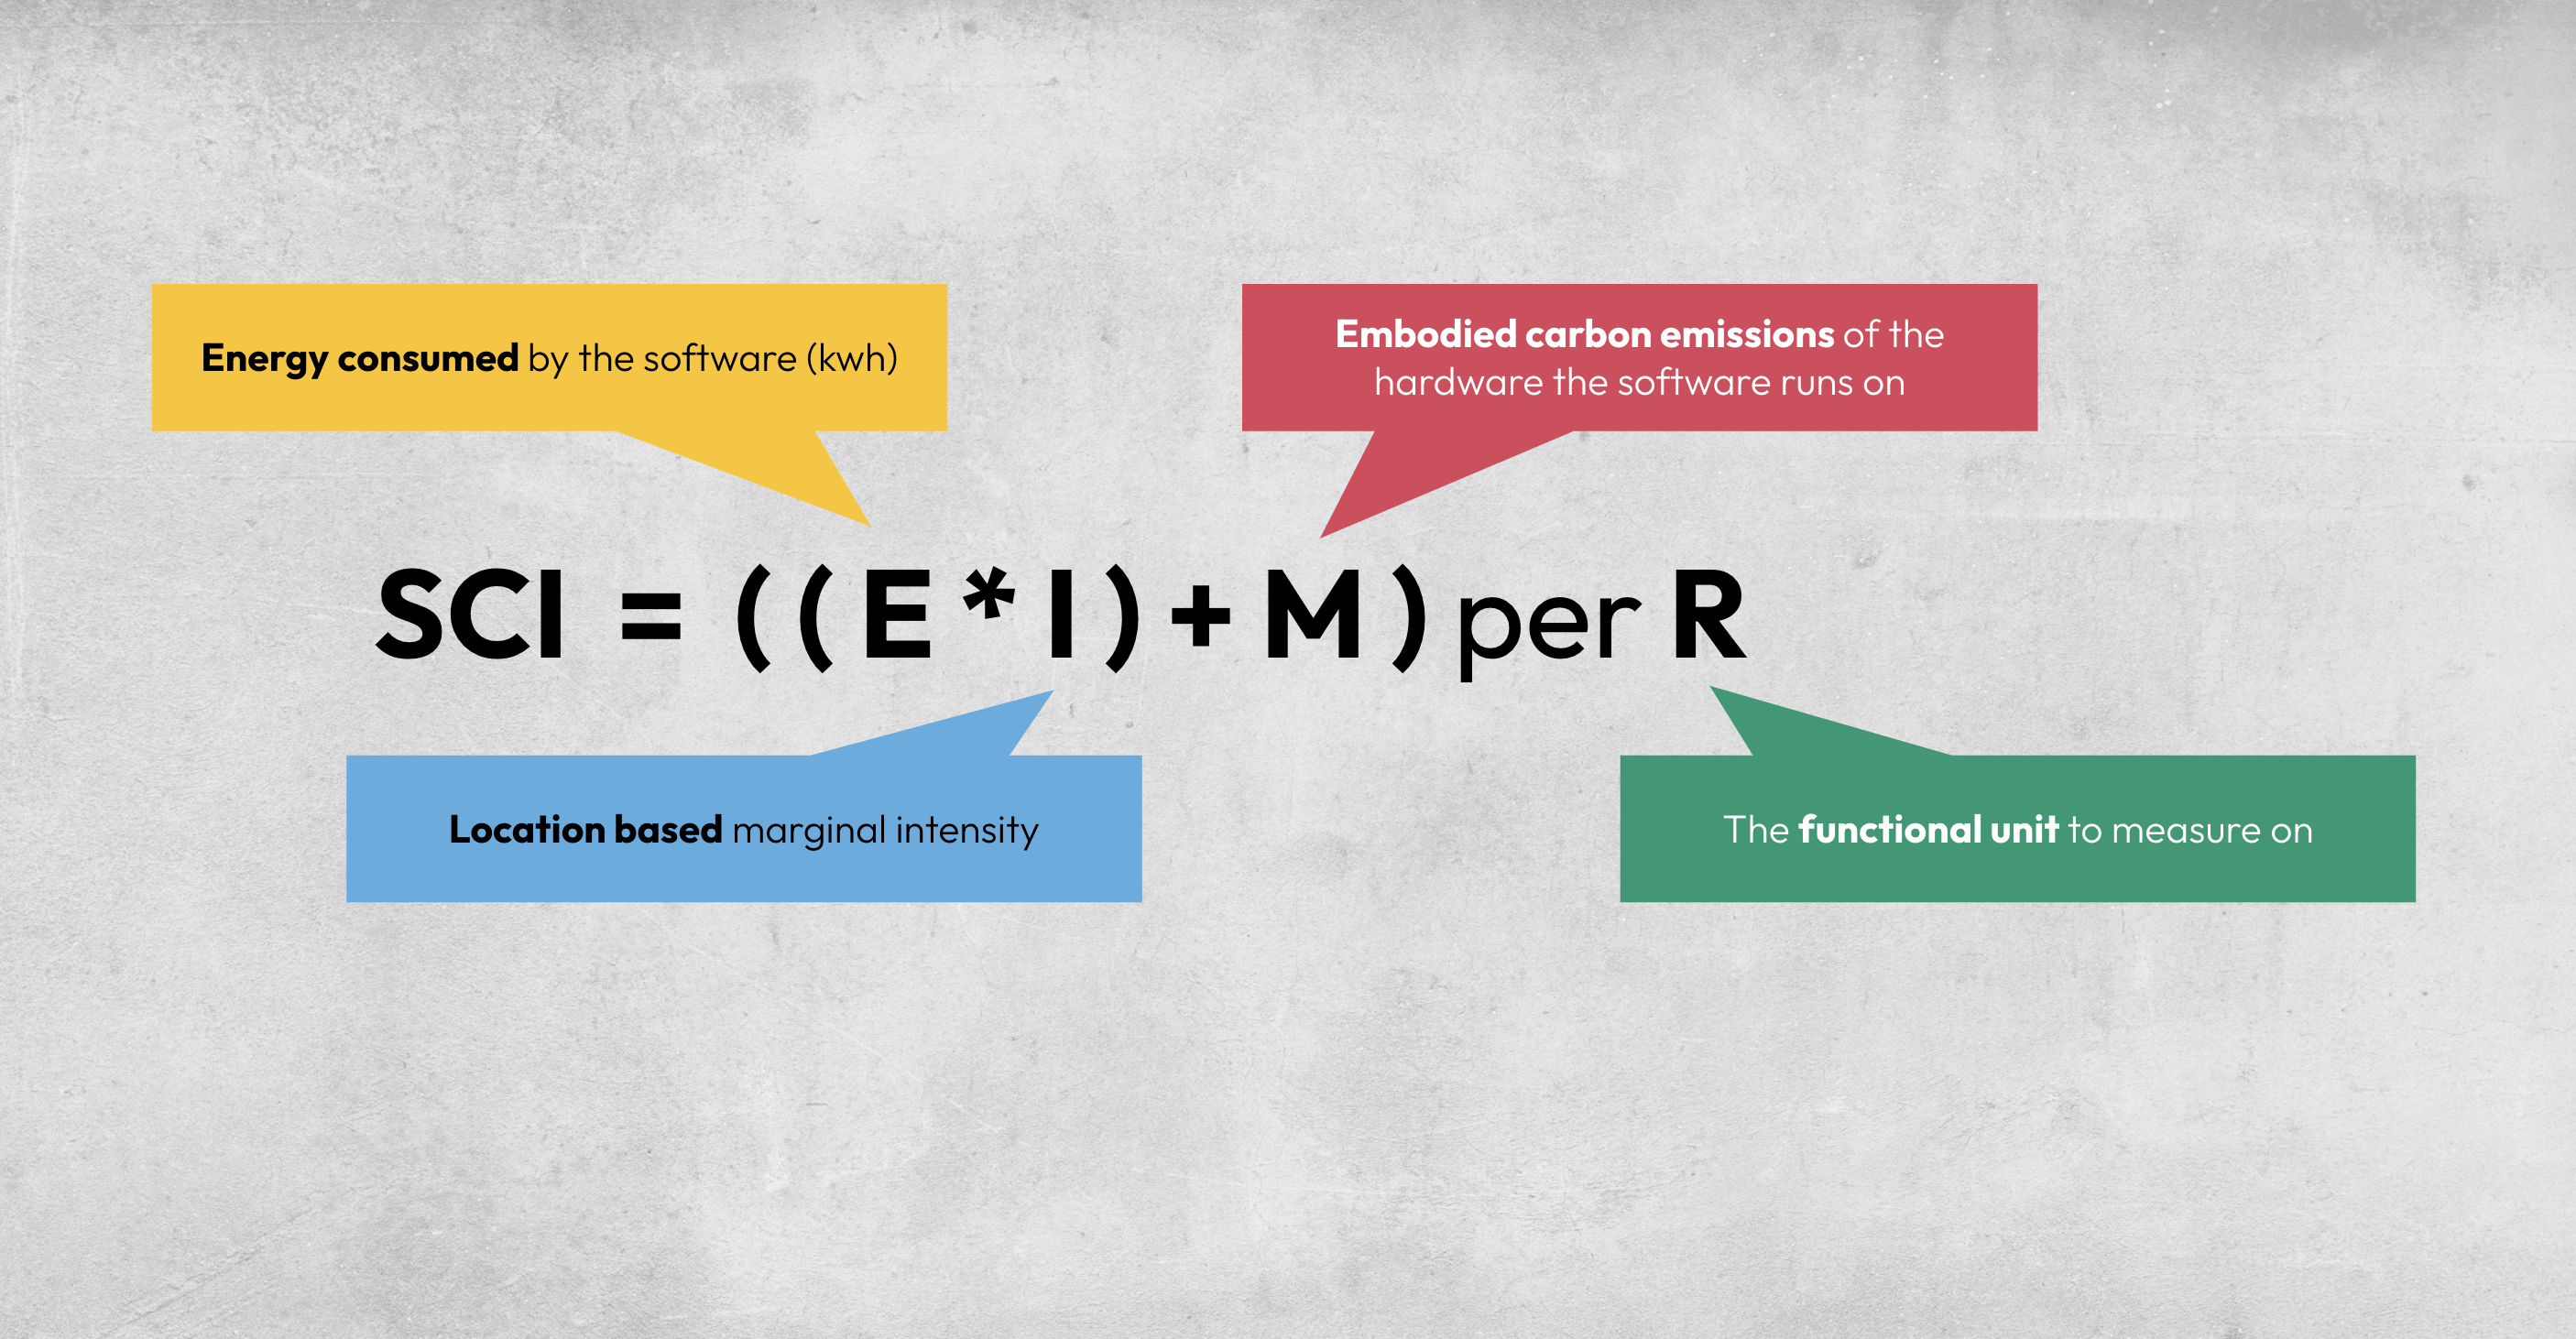
SCI = ((E*l) + M ) per R
E = Energy consumed by a software system
l = Location-based marginal carbon intensity
M = Embodied emissions of the hardware needed to operate a software system
R = Functional Unit.
The best way to understand the SCI is by example.
In the following scenario I have followed the guidance as set out by the SCI specification to calculate the SCI score of a web application running on AWS (keep in mind this is merely for illustrative purposes only).
Scenario: Web Application Running on a Public Cloud Hypervisor Platform Using Virtual Machine Instances.
Boundaries and Scope:
The web app is deployed on 4 virtual machine instances.
It uses a Relational Database service and a virtual storage solution.
Assume all these services run in a hypervisor location in America.
Functional Unit (R):
The functional unit will be 'the number of user requests served'.
Software Components:
Virtual server instances
A Relational Database Service
A virtual storage solution
Defining Energy Consumption (E):
In this scenario each virtual instance consumes an average of 200 watts (0.25 kW) per hour. This metric can be obtained by using open source tools such as power API.
The application runs on 4 *virtual instances, totalling 2 kW per hour.
The daily energy consumption = 2 kW * 24 hours = 48 kWh per day.
Defining Carbon Intensity (I):
Depending on the location of the hypervisor’s data centre it is possible that their infrastructure could be using renewable energy. These locations are preferred as it can significantly reduce the carbon intensity lower than the regional average.
For this scenario we will assume a carbon intensity of 300 gCO2eq/kWh (considering AWS's renewable energy usage) If the specific grid carbon intensity is not definable then a good alternative is to use a service such as electricity maps.
Operational Emissions Calculation (O):
Using the formula O = E * I
Operational emissions per day: 48 kWh * 300 gCO2eq/kWh = 14,400 gCO2eq/day.
Embodied Emissions (M):
Suppose the embodied emissions for the cloud infrastructure (servers, cooling, etc.) are 5,000 kg CO2eq (5,000,000 gCO2eq), spread over a 4-year lifespan. Embodied emissions information can be sourced through climatiq for example.
Daily embodied emissions: 5,000,000 gCO2eq / (4 * 365) = 3,424.66 gCO2eq/day.
Total Daily Carbon Emissions (C):
Total emissions (O + M) = 14,400 gCO2eq/day + 3,424.66 gCO2eq/day = 17,824.66 gCO2eq/day.
Number of Functional Units (R):
Suppose the application handles 100,000 user requests per day.
SCI Calculation:
Using the formula SCI = C per R
SCI = 17,824.66 gCO2eq/day per 100,000 requests/day = 0.1782 gCO2eq/request.
In this scenario, the estimated SCI score for the Web Application would be approximately 0.1782 grams of CO2 equivalent per user request. This figure is hypothetical, and real-world values might be significantly different based on detailed, precise measurements and calculations, as well as the specific configurations and resource utilisation of your web application. One aspect to keep in mind is that even if you don't act on the metric Co2 is still being emitted when servers are in an idle state due to the power draw needed to keep them active and hot (ready to respond to user requests).
What the SCI score gives us then is a baseline metric. The metric can be used as an evidence based decision making metric. It can be used to guide system design, development and deployment towards the following Sustainable Software Practices:
Energy Efficiency: Actions taken to make software use less electricity to perform the same function.
Hardware Efficiency: Actions taken to make software use fewer physical resources to perform the same function.
Carbon Awareness: Actions taken to time- or region-shift software computation to take advantage of cleaner, more renewable or lower carbon sources of electricity.
With the ultimate goal being minimisation of carbon emissions.
Whilst the SCI of 0.1782gCO2eq/request may seem insignificant, putting it in real terms a recent study of the CO2eq emissions compared the impact of streaming Olivia Rodrigo's hit single, 'Drivers License,' on Spotify (between January 2021 to May 2023) produces greater emissions than flying from London to New York and back 4,000 times, or the annual emissions of 500 people in the U.K.
In Summary
By understanding the carbon intensity of their software, developers can make more informed decisions about the design and architecture of their applications to reduce their carbon footprint.
Many stakeholders, including investors, consumers, and employees, are increasingly interested in the sustainability practices of companies. Offering transparency in terms of software carbon intensity can be a competitive advantage for tech companies, attracting a growing cohort of environmentally conscious consumers.
As countries and regions increase their climate change mitigation efforts, there's potential for more stringent regulations around carbon emissions. Companies might be required to report and reduce emissions across all sectors, including software.
Embrace the SCI, make informed decisions, recalibrate your digital solutions, and join the movement.
Every keystroke matters, every watt saved counts, and together, we can build a greener tomorrow through the software of today.
At V2 we embrace Sustainable Tech Practices for designing and building for a better future, under the mission of helping to #VersionUp our clients, our people and our communities.
References
Green Software Foundation (SCI)

